
 Lessons: 18Length: 2 hours
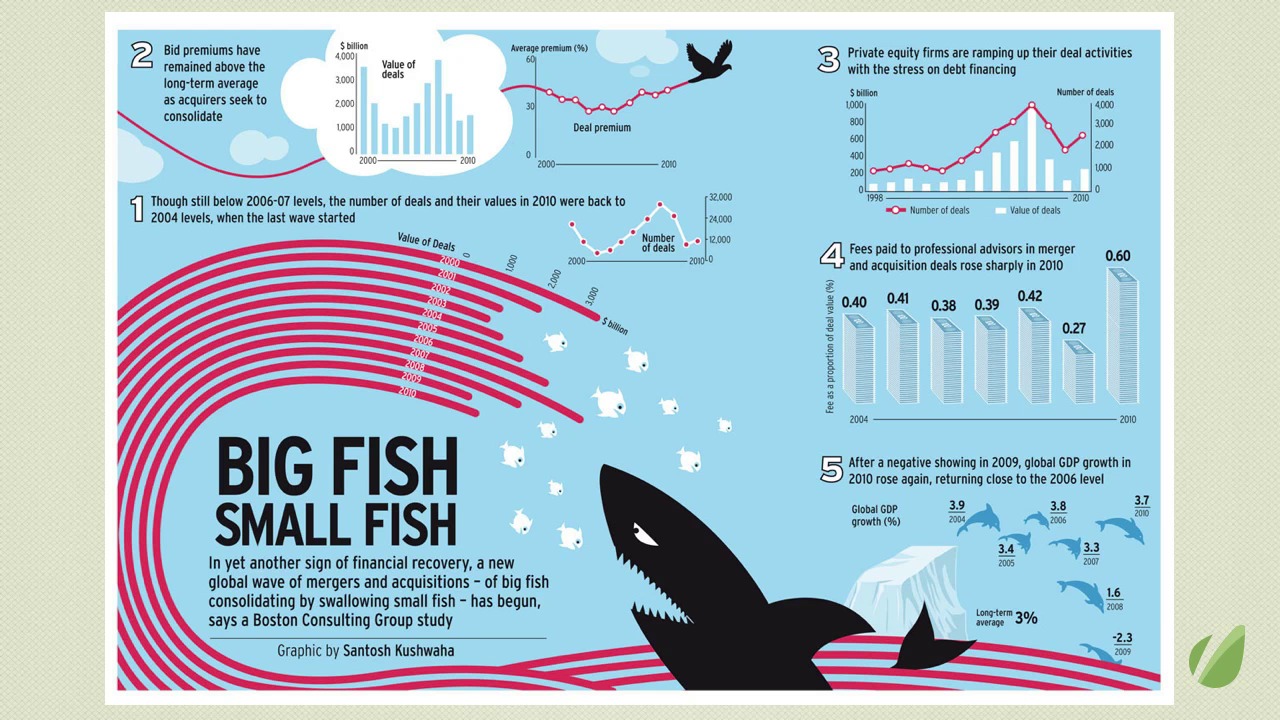
- Overview
- Transcript
4.2 Top Tips
- Double-check your data: This should go without saying, but that’s why it’s number one! The data is the “information” in information graphics. It’s easy to make a quick chart in your spreadsheet and see if anything looks off. The graphic is only as good as the data on which it’s built.
- Always source your data: Readers need to know where the data comes from for a couple of reasons. First, when the data is from a reputable, reliable source, it gives integrity to your graphic. Secondly, there may be some readers who want to find out more about the topic, or even fact check you. When they know the source, they can go to it. Also add a credit or byline. I believe this holds you accountable as a designer, and you never know, your graphic may find its way into the hands of someone who wants to hire the person who made it!
- Check your geometry: We saw how mis-calculating the size of circles can make them way out of proportion.
- Know your math: Learn the difference between percentage and percentage change. Learn the meaning of the terms Mean, Median, and Mode and use them correctly. Luckily, there are online calculators for this sort of thing, but you have to know where to start.
- Label the axes and include the units: You’d be surprised at how many times people leave these things out. Without labels and units, your charts are just lines and shapes – they have no meaning.
- Explain the encodings: This can be as simple as the title and descriptive text, or directly labeling the chart elements. A legend or a scale on a map are also ways to explain. Don’t assume the reader knows what it all means.
- Illuminate, don’t decorate: The data in your graphics is the main attraction. Anything that doesn’t support the data and/or add meaning is superfluous. Edward Tufte coined the phrase “chart junk.” You know it when you see it, and don’t do it.
- Don’t condescend – or confuse: I hate it when a graphic talks down to me and wastes my time. On the other end of the spectrum, we have the kind of graphic that is so over-designed that it obscures the data and makes it nearly impossible to comprehend. If you want to show off your design skills, do so by making the information clear, concise, and accessible.
- Consider your audience, and consider the topic: Keep in mind not only the subject matter of your graphics when choosing a color palette and overall design, but also consider who’s going to be reading it. Is it a big poster that someone’s going to spend some time with? Or, is it a quick chart to illuminate some key data?
- Use the right type of graphic: This should probably be higher up on the list. If you’ve watched all the videos I hope you have a good sense of which type of chart to use for which kind of data. Line charts to measure value over time, pie charts to show parts of a whole, scatter graphs to show correlation, and so on.
1.Introduction
1.1About the Course03:43
1.1
About the Course
03:43
1.2Data04:18
1.2
Data
04:18
2.Basic Graphs
2.1Line Charts11:18
2.1
Line Charts
11:18
2.2Bar Charts08:26
2.2
Bar Charts
08:26
2.3Pie Charts06:29
2.3
Pie Charts
06:29
2.4Area Graphs06:55
2.4
Area Graphs
06:55
2.5Scatter Graphs06:29
2.5
Scatter Graphs
06:29
2.6Bubble Charts09:31
2.6
Bubble Charts
09:31
2.7Locator Maps08:45
2.7
Locator Maps
08:45
2.8Choropleth Maps06:45
2.8
Choropleth Maps
06:45
2.9Timelines07:42
2.9
Timelines
07:42
3.Design Issues
3.1Variables05:09
3.1
Variables
05:09
3.2Color05:20
3.2
Color
05:20
3.3Typography03:37
3.3
Typography
03:37
3.4Math06:22
3.4
Math
06:22
3.5Big Graphics08:53
3.5
Big Graphics
08:53
4.Conclusion
4.1More Resources02:41
4.1
More Resources
02:41
4.2Top Tips05:04
4.2
Top Tips
05:04

