
 Lessons: 18Length: 2 hours
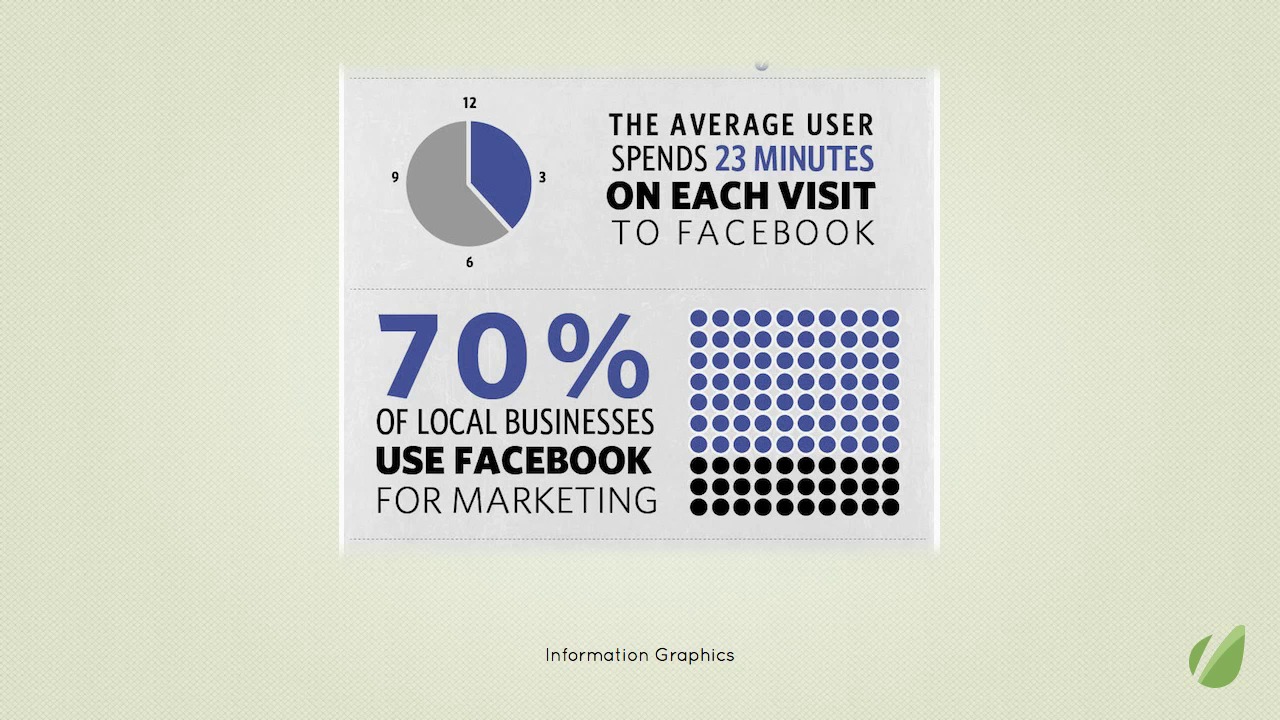

- Overview
- Transcript
3.5 Big Graphics
In this lesson, we’ll talk about those huge infographics that seem to be sprouting up all over the web. You mainly see these on the web, because space is unlimited. But there are some graphics that take that to an extreme. I made a graph out of some big graphics and a couple of them were too big to even fit! The biggest one tops out at over 16,000 pixels deep. The trend toward bigger and longer is so popular now, there are several parody graphics out there. And even though these are meant to be funny, they make some valid points about some of the cliches and mistakes that designers often seem to make.
- Don’t use subjective words or shocking statistics.
- If you have an agenda, be upfront about it.
1.Introduction
1.1About the Course03:43
1.1
About the Course
03:43
1.2Data04:18
1.2
Data
04:18
2.Basic Graphs
2.1Line Charts11:18
2.1
Line Charts
11:18
2.2Bar Charts08:26
2.2
Bar Charts
08:26
2.3Pie Charts06:29
2.3
Pie Charts
06:29
2.4Area Graphs06:55
2.4
Area Graphs
06:55
2.5Scatter Graphs06:29
2.5
Scatter Graphs
06:29
2.6Bubble Charts09:31
2.6
Bubble Charts
09:31
2.7Locator Maps08:45
2.7
Locator Maps
08:45
2.8Choropleth Maps06:45
2.8
Choropleth Maps
06:45
2.9Timelines07:42
2.9
Timelines
07:42
3.Design Issues
3.1Variables05:09
3.1
Variables
05:09
3.2Color05:20
3.2
Color
05:20
3.3Typography03:37
3.3
Typography
03:37
3.4Math06:22
3.4
Math
06:22
3.5Big Graphics08:53
3.5
Big Graphics
08:53
4.Conclusion
4.1More Resources02:41
4.1
More Resources
02:41
4.2Top Tips05:04
4.2
Top Tips
05:04

