
 Lessons: 18Length: 2 hours
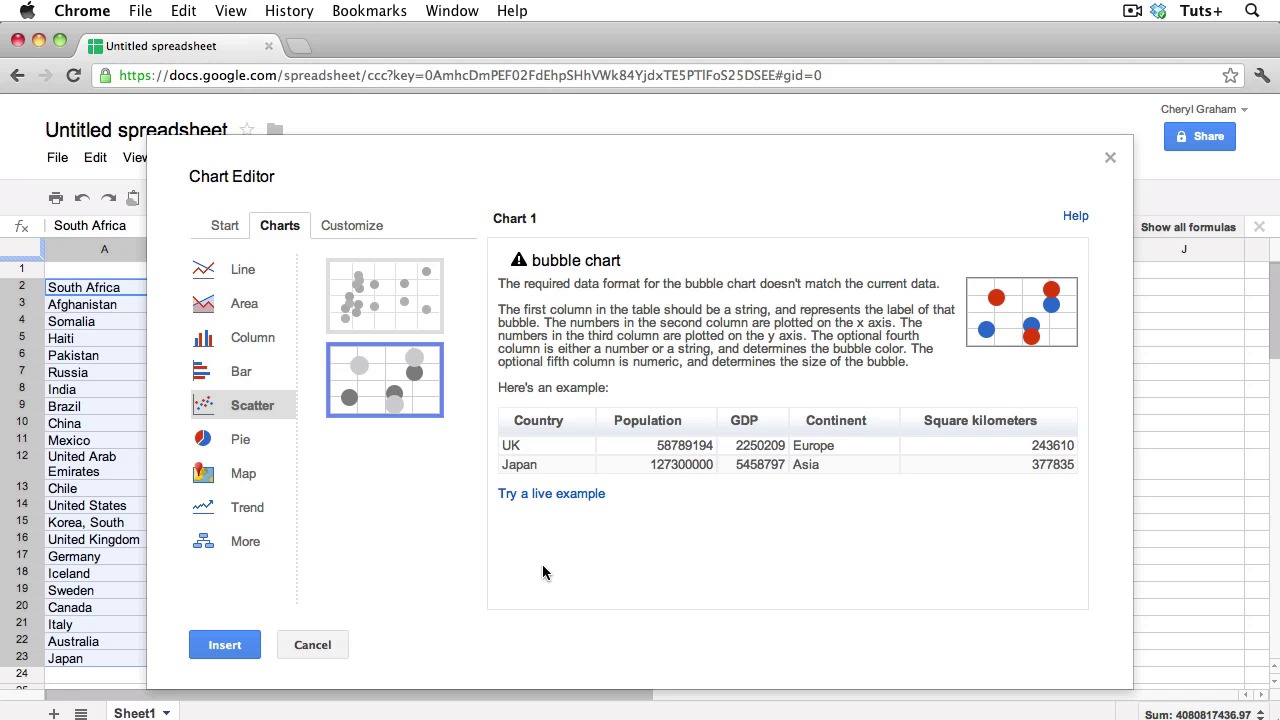
- Overview
- Transcript
2.6 Bubble Charts
In today’s lesson, I will go over Bubble Charts. A bubble chart usually uses circles to represent different data values, with the area of the circle corresponding to the value. The circles, or bubbles, can also be effective when comparing quantities.
- Do use area or size when drawing your bubbles, but don’t use radius or diameter.
1.Introduction
1.1About the Course03:43
1.1
About the Course
03:43
1.2Data04:18
1.2
Data
04:18
2.Basic Graphs
2.1Line Charts11:18
2.1
Line Charts
11:18
2.2Bar Charts08:26
2.2
Bar Charts
08:26
2.3Pie Charts06:29
2.3
Pie Charts
06:29
2.4Area Graphs06:55
2.4
Area Graphs
06:55
2.5Scatter Graphs06:29
2.5
Scatter Graphs
06:29
2.6Bubble Charts09:31
2.6
Bubble Charts
09:31
2.7Locator Maps08:45
2.7
Locator Maps
08:45
2.8Choropleth Maps06:45
2.8
Choropleth Maps
06:45
2.9Timelines07:42
2.9
Timelines
07:42
3.Design Issues
3.1Variables05:09
3.1
Variables
05:09
3.2Color05:20
3.2
Color
05:20
3.3Typography03:37
3.3
Typography
03:37
3.4Math06:22
3.4
Math
06:22
3.5Big Graphics08:53
3.5
Big Graphics
08:53
4.Conclusion
4.1More Resources02:41
4.1
More Resources
02:41
4.2Top Tips05:04
4.2
Top Tips
05:04

