
 Lessons: 18Length: 2 hours
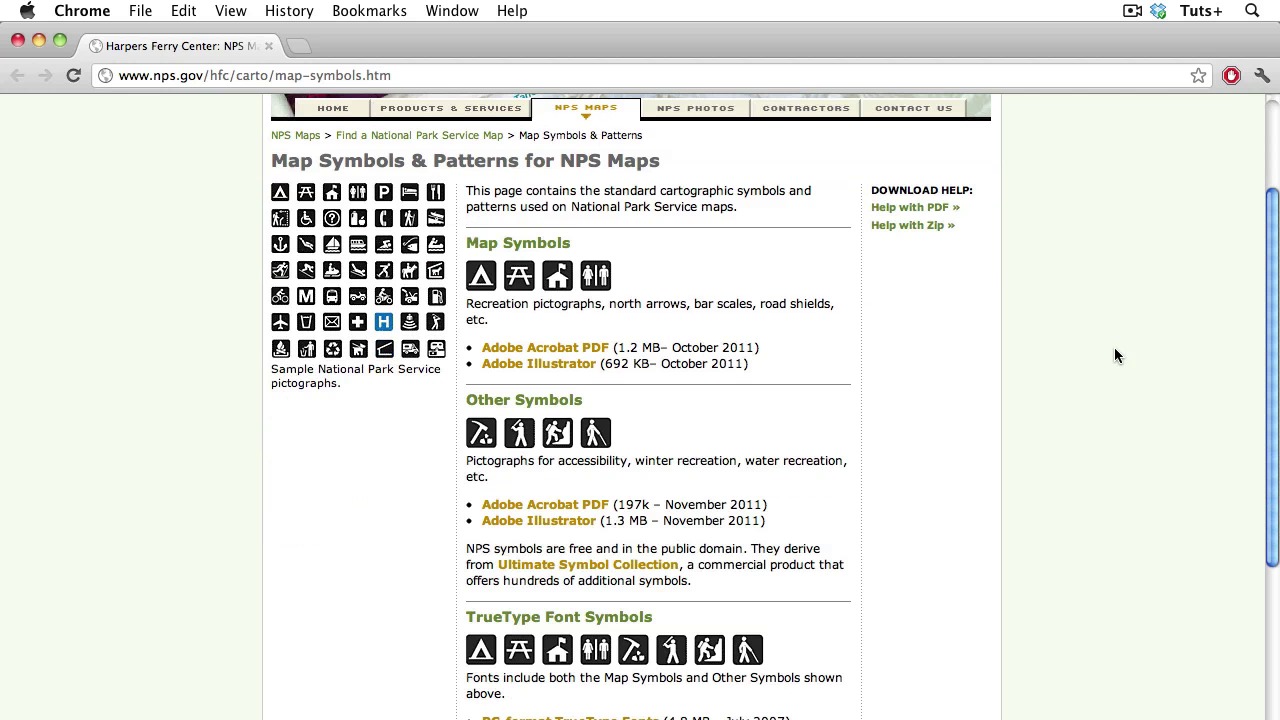
- Overview
- Transcript
2.7 Locator Maps
In today’s lesson, I will teach you about Locator maps. Locator maps are used, well, to locate something. Something that’s newsworthy, that’s going to happen somewhere, or has already happened somewhere. They can be used to locate something that may be unfamiliar to the reader and provide a larger context. They can be really simple or more complex. So, let’s learn to make them right!
- Don’t use really saturated colors
- If possible, put the map in a larger context: If you’re designing for a local paper, your readers probably know where things are in town, but consider using an inset with a broader view. You don’t have to use the entire world, but enough information to orient the reader.
- Be consistent with your colors and styles: Don’t make the reader work hard to understand your map. Taking the time to set up a template will not only ensure consistency, it will save you loads of time.
- Always use a directional maker and a scale: Most of the time we assume that north is at the top, but it’s always a good idea to indicate this on your map. A scale adds valuable information as to the size of the area depicted in the map and the relative distances between locations. A scale isn’t always mandatory, but you have to learn when you can’t leave them out!
- Use a Key or legend when necessary: Again, don’t make readers do any unnecessary work trying to interpret your map.
- Simplify! Your job as a designer is to convey the information as cleanly and quickly as possible. Keep the relevant, essential elements, and get rid of the rest.
1.Introduction
1.1About the Course03:43
1.1
About the Course
03:43
1.2Data04:18
1.2
Data
04:18
2.Basic Graphs
2.1Line Charts11:18
2.1
Line Charts
11:18
2.2Bar Charts08:26
2.2
Bar Charts
08:26
2.3Pie Charts06:29
2.3
Pie Charts
06:29
2.4Area Graphs06:55
2.4
Area Graphs
06:55
2.5Scatter Graphs06:29
2.5
Scatter Graphs
06:29
2.6Bubble Charts09:31
2.6
Bubble Charts
09:31
2.7Locator Maps08:45
2.7
Locator Maps
08:45
2.8Choropleth Maps06:45
2.8
Choropleth Maps
06:45
2.9Timelines07:42
2.9
Timelines
07:42
3.Design Issues
3.1Variables05:09
3.1
Variables
05:09
3.2Color05:20
3.2
Color
05:20
3.3Typography03:37
3.3
Typography
03:37
3.4Math06:22
3.4
Math
06:22
3.5Big Graphics08:53
3.5
Big Graphics
08:53
4.Conclusion
4.1More Resources02:41
4.1
More Resources
02:41
4.2Top Tips05:04
4.2
Top Tips
05:04

