
 Lessons: 18Length: 2 hours
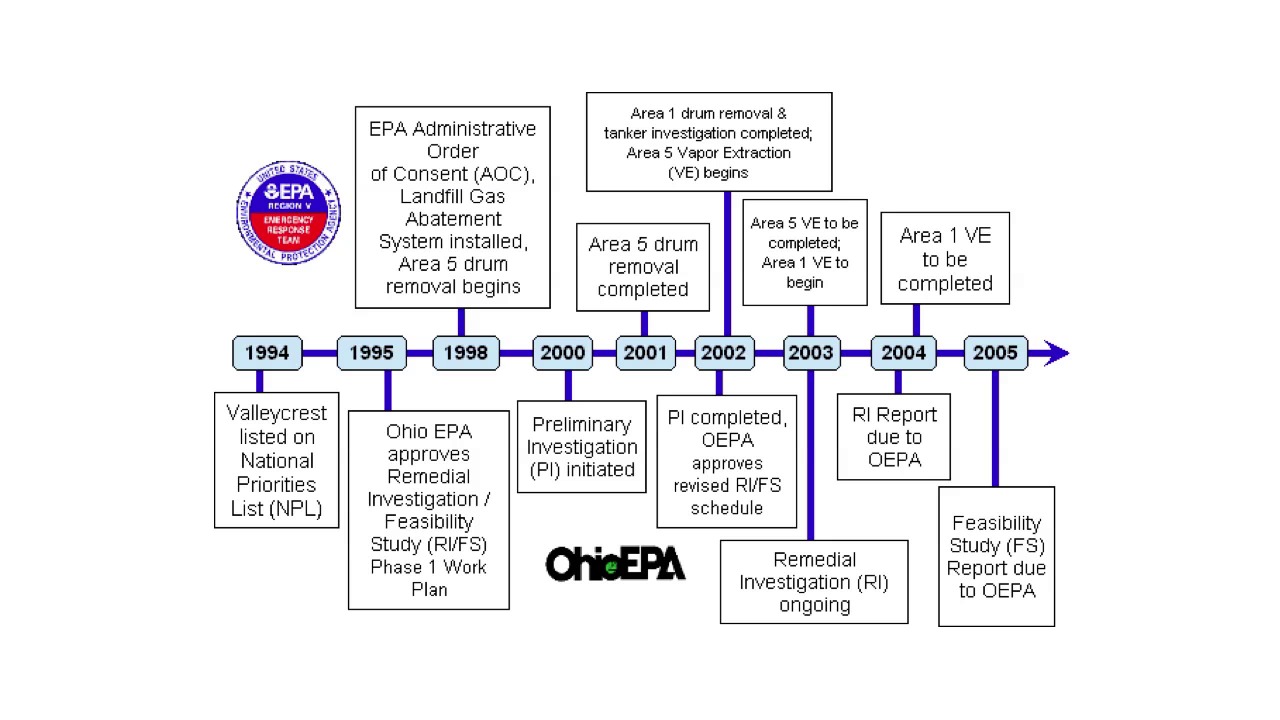
- Overview
- Transcript
2.9 Timelines
In today’s lesson, I will talk about a very familiar graphic: the Timeline. A timeline is simply a graphic representation of history. It’s typically a line, on which are events are listed in chronological order, usually accompanied by images. Because there’s no hard statistical data, they can be really fun to design because you don’t have to adhere to the same rules of data-driven graphics. Just design rules, of course. Let’s take a look at how to do them right!
- Don’t use too much text: A timeline should engage the reader and deliver the information quickly, not clobber them with too much to read. Especially if your readers are looking at a timeline on a specific topic, they’re going to know a lot of what’s in the text already, so edit it.
- Think about the subject matter and your audience: Use appropriate graphics and text for the subject matter. Nothing silly in a serious graph!
- Don’t use large graphics, too many graphics, or obscure graphics: That about says it!
- Don’t use Circular Timelines: I would advise against using a circular timeline. If it’s printed, people have to turn the magazine or newspaper, and if it’s on the Web, they have to turn their heads. Plus, it’s hard to tell where it starts. As with any kind of graphic, don’t make people work too hard to read it.
1.Introduction
1.1About the Course03:43
1.1
About the Course
03:43
1.2Data04:18
1.2
Data
04:18
2.Basic Graphs
2.1Line Charts11:18
2.1
Line Charts
11:18
2.2Bar Charts08:26
2.2
Bar Charts
08:26
2.3Pie Charts06:29
2.3
Pie Charts
06:29
2.4Area Graphs06:55
2.4
Area Graphs
06:55
2.5Scatter Graphs06:29
2.5
Scatter Graphs
06:29
2.6Bubble Charts09:31
2.6
Bubble Charts
09:31
2.7Locator Maps08:45
2.7
Locator Maps
08:45
2.8Choropleth Maps06:45
2.8
Choropleth Maps
06:45
2.9Timelines07:42
2.9
Timelines
07:42
3.Design Issues
3.1Variables05:09
3.1
Variables
05:09
3.2Color05:20
3.2
Color
05:20
3.3Typography03:37
3.3
Typography
03:37
3.4Math06:22
3.4
Math
06:22
3.5Big Graphics08:53
3.5
Big Graphics
08:53
4.Conclusion
4.1More Resources02:41
4.1
More Resources
02:41
4.2Top Tips05:04
4.2
Top Tips
05:04

