
 Lessons: 18Length: 2 hours
- Overview
- Transcript
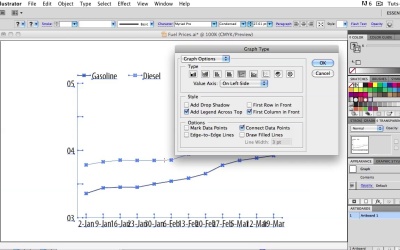
2.1 Line Charts
Welcome back to Information Graphics. In this lesson, we’re going to talk about Line Charts. You use a line a line chart whenever your data is about a trend. So if these kinds of words come to mind – growth, change, decrease — and so on, you know that a line chart is the way to go. A line by itself has no meaning. It’s only when we give it context that we can see the shape of the data over time. Let’s learn to use them properly.
- Make sure you’re telling the whole story and the accurate story.
- Look for outliers in your data: This is when Numbers or Excel comes in handy. You can make a quick chart with the click of a button, and readily see if something looks off. If so, go back to the source, or whoever gave you the data and double-check. Think about labeling any dramatic changes to give your readers more information and explain any apparent outliers.
- Pay attention to line weight: When you have a lot of numbers, a too-heavy of a line can obscure subtle changes.
- Use increments on the value axis that make sense and are easy to comprehend: People don’t usually think in multiples of six, for example. You don’t have to label every single value, but keep it to increments that people use commonly.
- No 3D: Numbers and Excel let you create 3-d charts very easily. You can even adjust the lighting and add drop shadows, and who know what else. Resist the temptation! Your graphics should be about information, not decoration.
1.Introduction
1.1About the Course03:43
1.1
About the Course
03:43
1.2Data04:18
1.2
Data
04:18
2.Basic Graphs
2.1Line Charts11:18
2.1
Line Charts
11:18
2.2Bar Charts08:26
2.2
Bar Charts
08:26
2.3Pie Charts06:29
2.3
Pie Charts
06:29
2.4Area Graphs06:55
2.4
Area Graphs
06:55
2.5Scatter Graphs06:29
2.5
Scatter Graphs
06:29
2.6Bubble Charts09:31
2.6
Bubble Charts
09:31
2.7Locator Maps08:45
2.7
Locator Maps
08:45
2.8Choropleth Maps06:45
2.8
Choropleth Maps
06:45
2.9Timelines07:42
2.9
Timelines
07:42
3.Design Issues
3.1Variables05:09
3.1
Variables
05:09
3.2Color05:20
3.2
Color
05:20
3.3Typography03:37
3.3
Typography
03:37
3.4Math06:22
3.4
Math
06:22
3.5Big Graphics08:53
3.5
Big Graphics
08:53
4.Conclusion
4.1More Resources02:41
4.1
More Resources
02:41
4.2Top Tips05:04
4.2
Top Tips
05:04

