Photoshop in 60 Seconds: What Are Histograms?


Welcome to our Photoshop in 60 Seconds series, in which you can learn a Photoshop skill, feature, or technique in just a minute!
Photoshop in 60 Seconds: Histograms
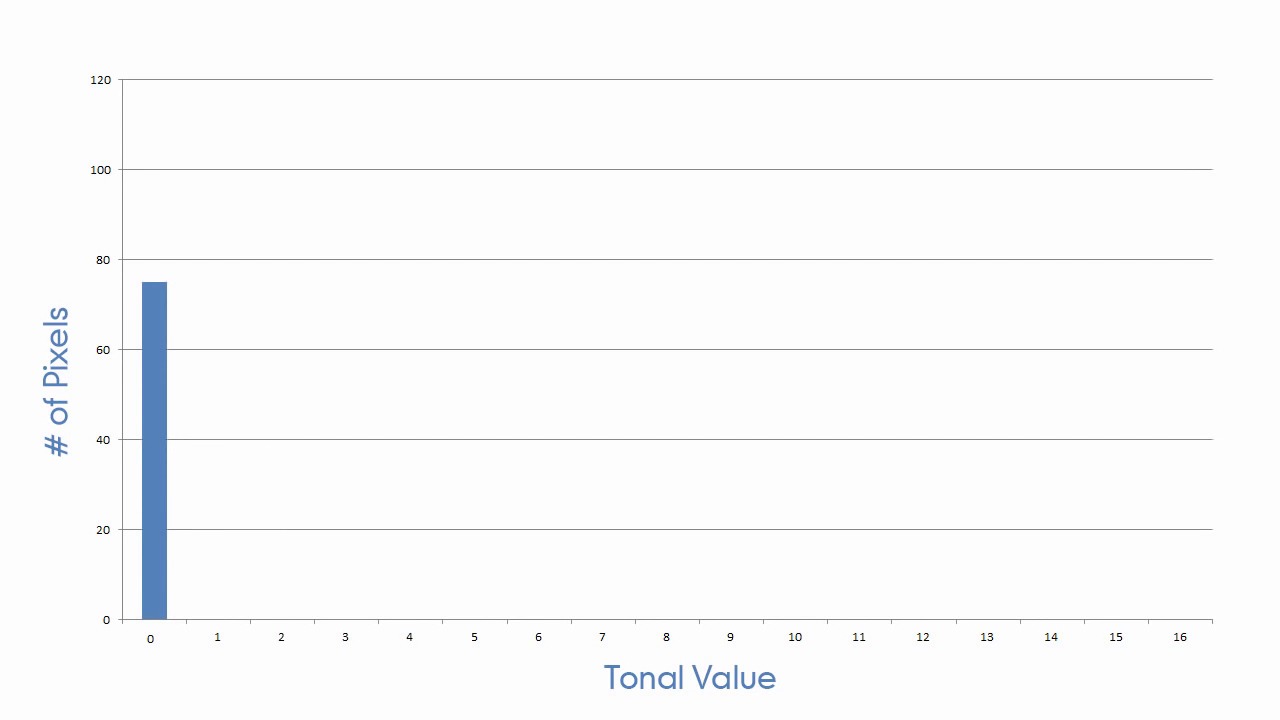
So what are Histograms? In Photoshop, Histograms are those graphs that are visible behind the Levels and Curves Adjustments. We've all seen them, but what do they mean?
Take just a minute and find out in the video below!

How to Use Histograms in Adobe Photoshop
You may have seen the Histogram panel in Photoshop before, but what is this graph?


In the Curves and Levels Adjustment windows, that's exactly what that graph is. A chart of the tonal range of the image.


In the Histogram panel, the chart is further broken down by color intensities for each Color Channel.


Want to see this in action? Check out the video above to see this lesson at work!
A Bit More Detail
Want to learn more about Adobe Photoshop's vast tools and settings? Check out these tutorials below:


 The A to Z of Adobe Photoshop

 Mary Winkler19 May 2014

 Master Adjustment Layers in Adobe Photoshop

 Kirk Nelson21 Sep 2015

 Photoshop in 60 Seconds: What Are Artboards?

 Kirk Nelson02 May 2016

 How to Use Color Look-Up Tables

 Kirk Nelson08 Feb 2016
60 Seconds?!
This is part of a new series of quick video tutorials on Tuts+. We’re aiming to introduce a range of subjects, all in 60 seconds—just enough to whet your appetite. Let us know in the comments what you thought of this video and what else you’d like to see explained in 60 seconds!


